
1 - First steps with QGIS
I will run through this tutorial with the idea that the reader has no prior geospatial experience, but is somewhat familiar with general computer use - this means that if you do have some GIS experience, you may feel the need to skip some sections or pick and choose bits to work on. Feel free to use this tutorial in whatever works best for you.
QGIS is a wonderful free, open-source program that has many functions (rivaling similar expensive closed-source proprietary software that is available). I have been using it for over 4 years and have been able to watch new features come to fruition that I have began using in my day-to-day mapping.
The documentation for QGIS is robust and describes most things in much more detail than I will in this article. I will provide links to relevant documentation sections when I can, so you can look for more information in the topics that I am discussing.
The Getting Started Using QGIS has handy links for downloading QGIS, as well as various links to user guides, training manuals, and tutorials. Feel free to browse through these as well as they are good resources.
Downloading & installing QGIS
There are multiple ways to download & install QGIS. In this tutorial I will be using QGIS-3.28.0 which is the latest version with the newest features. If you are not worried about new features, but would rather have a more stable experience, then the LTR version can be used. It is known to be more stable however it gets updated less frequently.
Head to the QGIS Downloads page. If you’re on Windows download either the OSGeo4W Network Installer or the QGIS 3.28 standalone installer. If you’re on Linux, or wish to download the LTR version, visit the all downloads page.
Windows Installation

The Download for Windows section
The Standalone
QGISInstaller is a.msifile, and better choice if you want an easier installation and don’t care about re-downloading it from the website each time you want to update the software. It will be a more familiar installation process and may be better for those without much computer knowledge.The OSGeo4W Network Installer is useful if you are interested in keeping your
QGISinstallation up to date, without needing to download a new installer each time. You can use the OSGeo4W setup software to download and install many different open-source geospatial software and libraries as well, so I recommend it over the standalone installer if you are going to continue learning about GIS topics/software.
Linux Installation
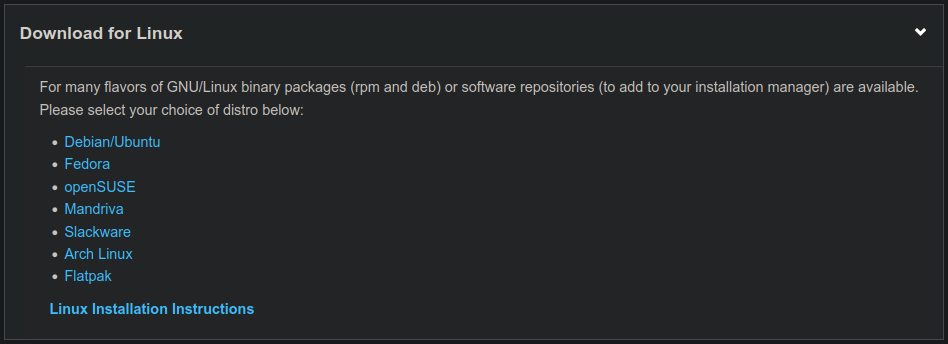
The Download for Linux section
QGIS is available on for many Linux distributions. Visit the All Downloads/Linux page for information on your specific distro.
Arch Linux
If you are on Arch Linux, you can install the latest QGIS with:
sudo pacman -S qgis
Debian/Ubuntu
If you are on Debian/Ubuntu, you will have to add a repository to get the latest version of QGIS. The default repo on Debian/Ubuntu contains an older version (3.10.14 at the time of writing). Visit the Debian/Ubuntu Section for complete instructions on adding the repo and installing QGIS.
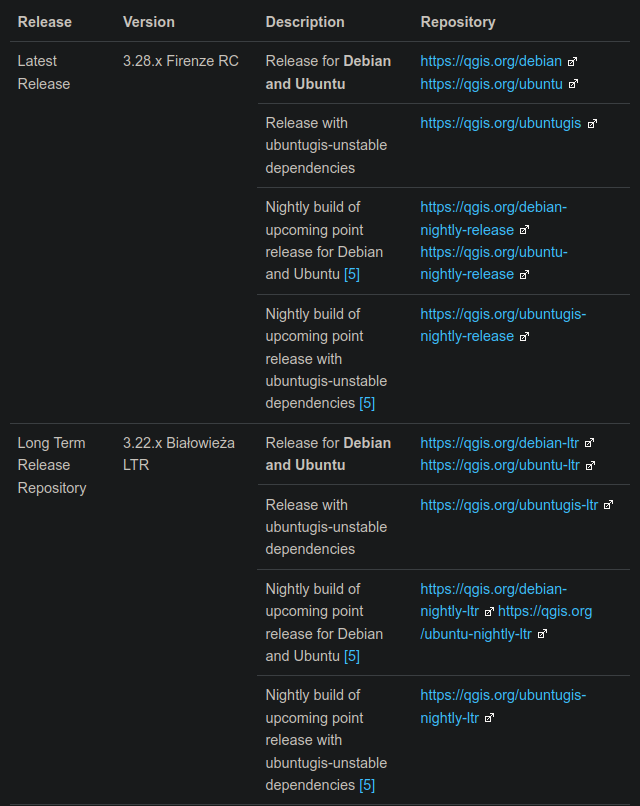
Debian/Ubuntu Repository List (Latest / Long Term Release)
Other Distros
Visit the All Downloads/Linux page for installation instructions for the other distros included in the screenshot above.
Build instructions are also available on GitHub.
Flatpak
A Flatpak is also available if you prefer using software this way.
2 - Geospatial basics
Before we dive into QGIS, we will need to cover some geospatial basics.
Some definitions
Project
The GIS software document that holds all of the information for each layer (path to data sources, hierarchal order, styles, etc.) and other information such as map layouts, metadata (author/company/etc.), and projection info (and much more). An example of a project file is the .qgz, .mxd, or .aprx. An important thing to remember about projects is that they do not hold the data of the layers themselves - just the information on how to find them.
Layer/Feature Class
A layer, in the geospatial realm, usually refers to a group/set of features (e.g. the contents of one shapefile) that is loaded into a GIS application. A layer can have it’s symbology/colours/labels individually customized and can be toggled on and off within a project. A layer can also be referencing a raster image instead of a vector shapefile.
Similar to the project: a layer in your project IS NOT the same as the underlying geospatial data. Pay attention to the following example:
Take a look at the following example. I take a polygon layer and duplicate it in the Layer Panel of QGIS, then change the colour and edit one of the layers. You can see that after saving the edits, and zooming out and in (re-rendering the map), the features of the first layer are updated to match the second layer.

It is important to remember that although two layers may be visible in QGIS, they can both referencing the same data source.
Feature
A feature is the individual geometric shape that can be visualized in GIS software, contained within a layer/feature class. A feature may be a point, a line, or a polygon shape, and can have any number of attributes filled with information of various data types.
For instance, a feature in a road layer might have the following attributes:
| Attribute Name | id | Name | Status | Type | Surface_Material | Median | Lanes | Width (m) | Last_Inspection | Construction_Date |
|---|---|---|---|---|---|---|---|---|---|---|
| Data Type | Integer | String | String | String | String | Boolean (True/False) | Integer | Double | Datetime | Datetime |
| Example Value | 194057 | Main St. | Official | Highway | Asphalt | True | 4 | 9.5 | 2021-08-19 12:00:00 | 1967-02-05 |
Points, Lines, Polygons

Points, lines, and a polygon displayed on a simple graph.
Vector features are often described as a point, a line, or a polygon. One common way of writing out geometries is “Well Known Text” or WKT.
A point is simply a pair of X and Y coordinates. An example of two points written in WKT:
POINT (1 4)
POINT (3 1)
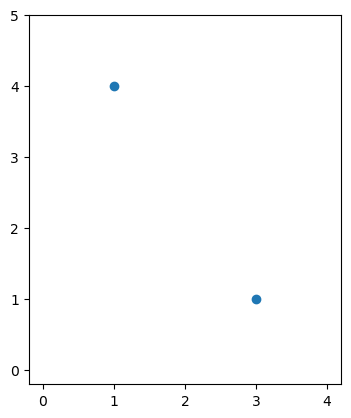
POINT (1 4), and POINT (3 1) plotted on a graph
A line is essentially just a series of points/coordinate pairs.
An example of two lines written in WKT would be:
LINESTRING (1 3, 3 5, 5 5)
LINESTRING (0 1, 4 2, 5 3)

LINESTRING (1 3, 3 5, 5 5) and LINESTRING (0 1, 4 2, 5 3) plotted on a graph
Last, polygons are similar to lines in that they are just a series of points/coordinate pairs, but the first and last coordinate pair is the same.
A polygon in WKT would be written as:
POLYGON (2 6, 4 8, 4 6, 2 6)
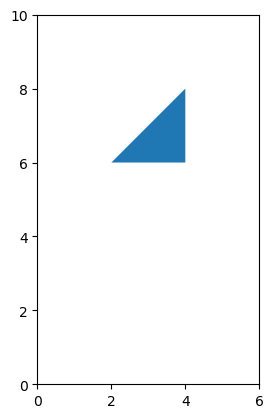
POLYGON (2 6, 4 8, 4 6, 2 6) plotted on a graph
Vector vs. Raster
Generally speaking, there will be 2 types of layers you work with: vector and raster. So far I’ve only been discussing vector layers, which are made up of geometric features (points & lines & polygons) and have attribute information tied to each feature.
Rasters however, are essentially just images: a matrix of pixels. Each pixel contains a value, which can be classified and styled in different ways or further analyzed.

4 types of raster: Canopy Height, Slope, Digital Terrain Model, and Hillshade (from the Savary Island PDAL Tutorial). Contains information licensed under the Open Government Licence – British Columbia.
Rasters can come from a variety of sources - LiDAR-equipped aircraft, remote sensing imagery from satellites, among others.
The resolution of a raster (height/width of one pixel) affects how detailed the raster is, but also how large it is. For example, a raster with pixels that are 20m x 20m will be much smaller than a raster with pixels that are 1m x 1m.
We won’t dive too much into raster layers in this tutorial - but we will be using one as a basemap!
3 - Geospatial data
Finding geospatial data
Sourcing geospatial data can be tricky if you don’t know where to look. I often use government sources such as the BC Data Catalogue or the Gov’t of Canada’s Open Data portal. I don’t know for sure but I imagine each province has it’s own database of geospatial data to browse through.
Examples of data that can be found on government databases are: Contour lines, Waterbodies & rivers, Land Ownership & Parcel data, Forestry License Boundaries, Roads, Cutblocks, etc.,
I have also used some data from the World Bank Open Data portal - not geospatial, but it contained identifiers I could use to join to other geospatial layers. I did this with population data for my #30DayMapChallenge Day 9 map, joining it to the countries layer to connect the population data with each country polygon.
Other sources of data include free datasets such as the Natural Earth data which is available in 3 different scales and a variety of formats.
Over time, you’ll become more familiar with each database and what information they offer, and find new sources of data.
Important Note on License / Terms of Use
When you are downloading data from online sources, it is very important to know what the License or Terms of Use are. Make sure to give credit when it is required or you may be breaking the license agreement. Below are examples from Natural Earth, and the license that is attached to some (not all) datasets on the BC Data Catalogue.
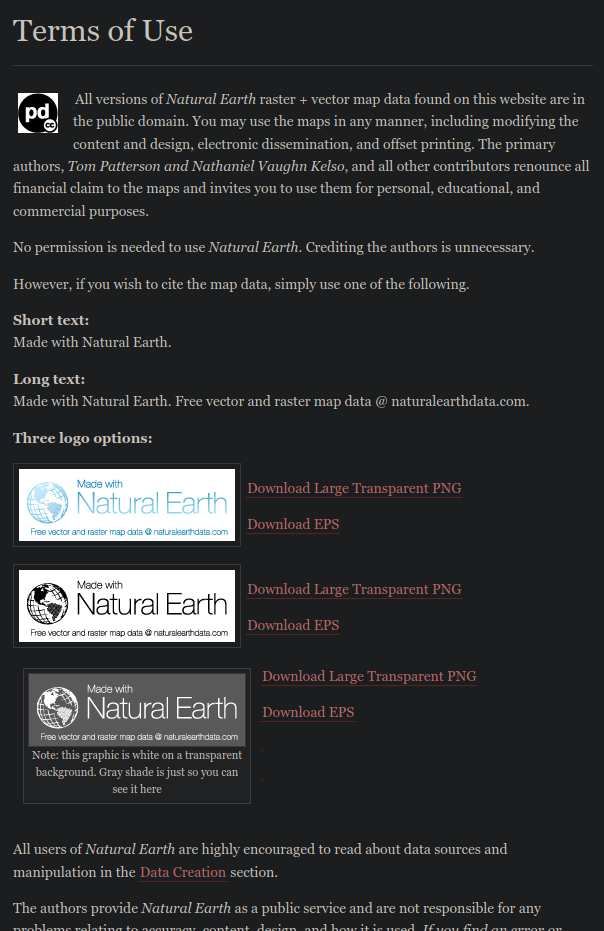
Natural Earth Terms of Use

Open Government License - British Columbia
You should note that BC’s license requires you to include a link and/or a specific attribution statement when you use data provided under this Open Government License. However, Natural Earth’s Terms of Use state that attribute is not necessary. Some licenses even state that you are unable to reproduce the data in any way.
It is important to know that licenses can be extremely different and you need to ensure that you are respecting licenses and terms of use. Be sure of licensing information rather than blindly using data that you find.
Geospatial File Formats
Now that we have some sources of data, and we are aware of some of the various data licenses and Terms of Use, we can look at the actual files that we can download.
There are a few common geospatial file formats that are used. Below is a table with some that you may encounter, with any important notes. See a more complete list here on Wikipedia.
| Format Name | File Extension | Notes |
|---|---|---|
| ESRI Shapefile | .shp + .dbf + .shx + optionally others | Only can contain one layer. Proprietary file format from ESRI - very wildly used and extremely common to see in the wild. Most of the geospatial data I send/receive for work is in shapefile format. The .shp file MUST be accompanied by at least the .dbf, and .shx, and potentially other sidecar files such as .prj (which contains projection info), .cpg (showing file locale), and others |
| ESRI File GeoDatabase | .gdb | Can contain many layers within. Closed-source from ESRI. Looks like a folder if viewed from Windows/Linux file explorer. Can be opened but will contain files that look like gibberish. When viewed from the Browser within QGIS or other GIS software, the layers inside can be viewed & dragged into your project |
| GeoPackage | .gpkg | Can contain many layers within. A database, similar to ESRI’s file geodatabase, except open-source. Does not look like a folder in the file explorer, and similarly can be viewed within the QGIS Browser |
| GeoJSON | .geojson | An up and coming open-source format that I am starting to see more often. Haven’t used them too much myself but I am interested in the ease of them compared to shapefiles |
| Keyhole Markup Language | .kml, .kmz | A filetype that was create for (what is now) Google Earth, it is still around and is used by some field-map applications (like Avenza maps). Has some issues with attributes being lost due to the way they are stored. |
| CSV (Comma Separated Values) | .csv | A table that contains data separated by commas, semi-colons, or other symbols. Can contain a column with geometry information, in WKT, or columns with X and Y point coordinates. |
| GeoTIFF | .tif | A common raster file format, which is georeferenced, and can be further optimized to a Cloud-Optimized GeoTIFF |
| LAS/LAZ Point Clouds | .las, .laz | A point cloud file - often contain a huge (1,000,000+) amount of points. These point clouds are used to create raster of the terrain elevation, surface (canopy) elevation, slope, etc. |
A Closer Look: BC Data Catalogue Dataset
This might not be super relevant to everyone, especially if you don’t live in British Columbia - however most databases should have a similar system.
Let’s take a look at the Forest Road Segment Tenure dataset page in the BC Data Catalogue. We can see that it is listed with the Open Government License - British Columbia - so we are free to use it, however we need to supply a link and/or a attribution statement.
This dataset contains road permit / tenure information for forestry roads in BC. It can be useful for backroads/camping maps, for planning trips, and for work & safety.
Looking at the right side of the page, we can see various ways to download the data.
](/posts/qgis-getting-started/part-one/images/bc-data-resources.png#center)
BC Data Catalogue Resources section for Forest Road Segment Tenure
If you click “Access/Download” under BC Geographic Warehouse Custom Download, a new window will pop up with the database’s checkout form to download the data in a variety of formats:
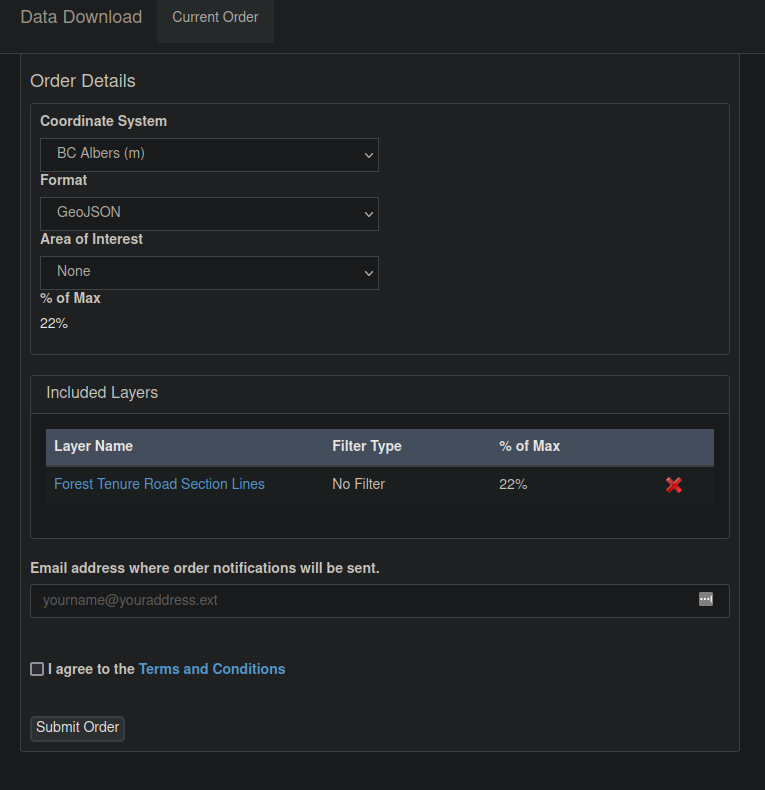
BC Data Catalogue custom download window
Using the Format dropdown, you can choose between a few common geospatial formats:
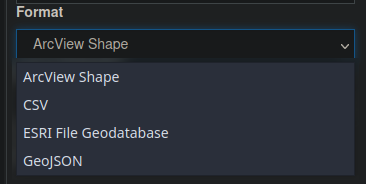
The formats available for download from BC Data Catalogue custom download
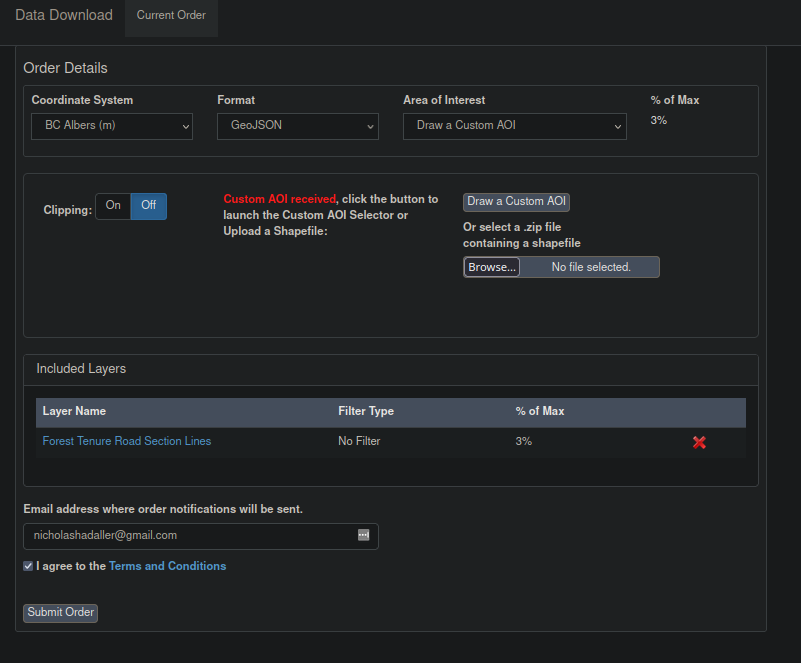
You can upload an Area of Interest or use the built-in tool to select a subset of the data. I will select a bounding box using the website’s AOI Selector by selecting “Draw a Custom AOI” and clicking the button that show up below.
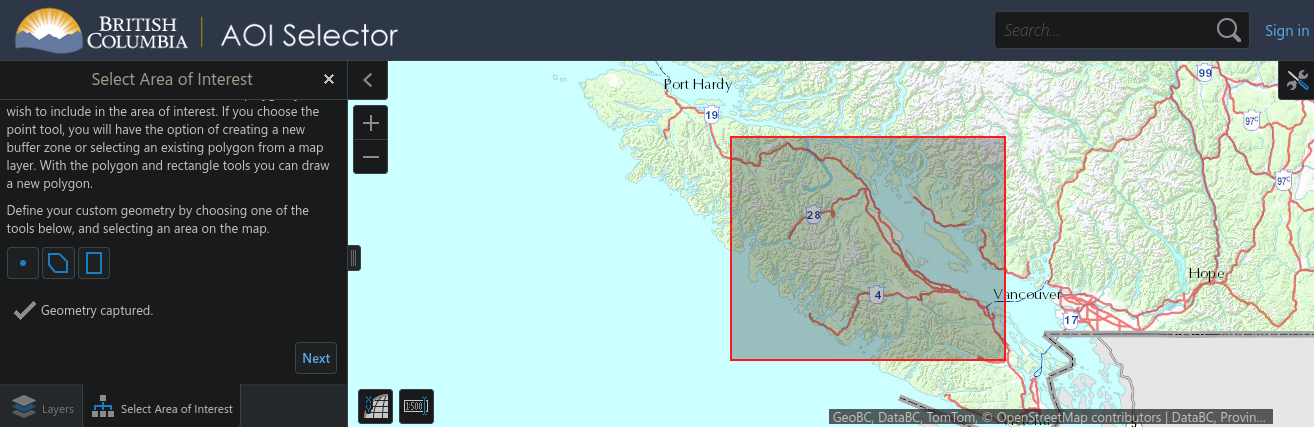
BC Data Catalogue AOI Selector
After choosing a format (I chose GeoJSON to try it out), setting the AOI, and choosing a Coordinate System (choose BC Albers (m) or Geographic Long/Lat if you don’t know), you can enter your email adress and the Warehouse will gather the requested information and send a link to download it via email. Some databases will forego this email step and just let you download the data directly.
BC Data Catalogue AOI Selector
After receiving the email and downloading the archived GeoJSON file, we’ve actually downloaded some geospatial data! In the next part, we will use this data to make a map!
Natural Earth Vector
Before we start actually mapping with the data we’ve got, let’s grab some Natural Earth data. Head to the downloads page and choose a package to download.
The easiest would be to download the All Themes GeoPackage (436mb), which contains all the vector layers for each scale. I will assume that this is what you’ve downloaded and will be referencing this in part 2.
If you download the Quick Start Kit (219mb), you will also find premade QGIS projects with pre-styled layers at different scale levels. It is handy if you want to work with a pre-made project, but it isn’t what we are going to cover in this tutorial.
Continued in Part 2
This page has gotten quite long by itself, and we are at a natural breaking point before we dive into loading data into QGIS, styling the data, and preparing a layout for export. We will explore all of those things in part 2!
Summary
Here in part 1, we discussed:
- Introducing
QGISand some helpful documentation links - Installing
QGISon either Windows or Linux - Geospatial basics: project, layer, feature, vector vs. raster, points/lines/polygons
- Finding sources of geospatial data
- License & Terms of Use for geospatial data
- A few common geospatial data formats & services
- Downloading geospatial data from both the
BC Data Catalogueand theNatural Earthdataset
I hope you’ve found this helpful and are excited to continue in the next section.
Part 2 is under construction and will be coming soon!